

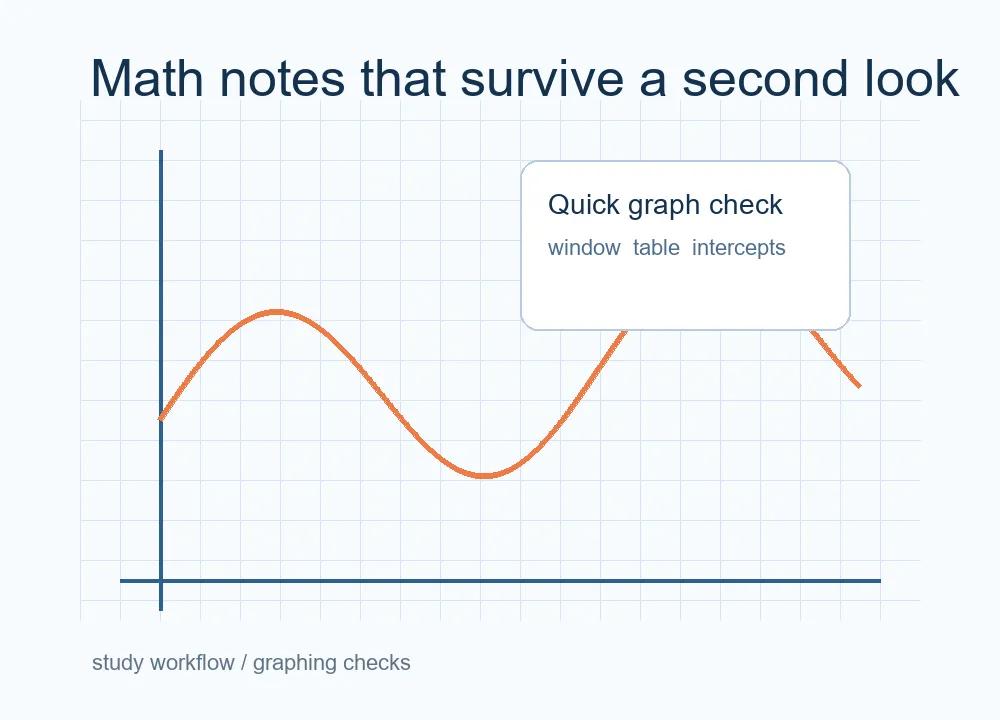
When a math note is written quickly, the part that usually causes trouble is not the final answer, but the small checks in between: whether the graph window is sensible, whether the table matches the equation, and whether an intercept was copied correctly.
A useful habit is to run one quick graph or table check before turning notes into a worksheet, a study guide, or a tutoring example. I often prefer a browser tool such as TI 84 Calculator Online for this because it keeps the check lightweight. You can test the shape of a function, compare values, and catch obvious mistakes without opening a larger workflow.
It does not replace understanding the math, but it works well as a second pass before sharing examples with classmates or students. A few minutes of checking can prevent a long explanation from being built on the wrong window or copied value.The first check is the viewing window. A correct graph can look wrong if the x and y ranges are too narrow, and a wrong graph can look convincing if the window hides the part where the function changes behavior. Before copying a sketch into notes, it helps to ask whether the window includes the intercepts, turning points, asymptotes, or end behavior that matter for the problem. This is especially useful for quadratics, rational functions, trigonometric functions, and systems where the interesting point may sit outside the default view.
The second check is a short table of values. A graph gives the shape, but a table makes the arithmetic visible. Pick a few x-values that are easy to calculate by hand, then compare them with the tool output. If the values disagree, the issue is often a sign error, a missing parenthesis, or a coefficient that was typed into the wrong place. This is a calmer way to catch mistakes than rereading a long solution from the beginning.
For classroom notes, I like to separate checking from solving. Solve the problem first, then use the calculator as an independent reader. If the graph, table, and algebra tell the same story, the explanation is much more likely to hold up. If they disagree, that disagreement becomes the next useful question: did the setup fail, did the notation get copied incorrectly, or does the problem need a different representation?
This habit also helps when preparing examples for someone else. A student may not need to see every behind-the-scenes check, but the writer benefits from doing them. Before sharing a worksheet, it is worth confirming that the plotted curve matches the written equation, that the intersection shown on the graph is actually the solution being discussed, and that the scale does not exaggerate or flatten the feature the example is meant to teach.
Another practical detail is naming the reason for each check. Instead of writing “verified with calculator,” write something more specific in your own notes: “table confirms y-intercept,” “graph window adjusted to include vertex,” or “intersection checked near x equals 2.” These small notes are not formal proof, but they create a trail that is easy to follow later. When you come back to the same topic before a quiz, the note tells you what was being checked and why it mattered.
Graph checks are also useful for spotting unreasonable answers. If a word problem asks for a positive time, a negative x-value might be mathematically possible but not meaningful in context. If a model describes revenue, the y-values should make sense for the units in the question. Looking at the graph after solving can reveal when an answer technically comes from the equation but does not belong to the situation.
There is still a limit to this workflow. A graphing tool should not become a substitute for understanding transformations, domains, or algebraic steps. The point is to make the thinking easier to audit. When students rely only on the display, they may miss why the result happened. When they use the display after doing the reasoning, it becomes a useful second opinion.
For longer study sessions, I keep a simple three-part rhythm: enter the equation carefully, choose a window that matches the question, and compare at least two table values with the written work. That takes very little time, but it catches many of the errors that make homework explanations confusing. It also makes the final notes feel less fragile, because the graph is no longer decoration; it is part of the checking process.
The best math notes are usually not the neatest ones. They are the ones that explain what was tested, what was rejected, and why the final answer is reasonable. A quick graph check is one small way to make that process visible without turning a short example into a long proof.Over time, this routine becomes less about checking a calculator screen and more about building a reliable habit: pause, compare, and make the hidden assumptions visible before the note is shared.A final check I find useful is to compare the visual result with a plain-language sentence. For example, after graphing a line, the note might say, “as x increases, y increases at a steady rate.” After graphing a parabola, the note might say, “the graph falls, reaches a lowest point, and rises again.” These sentences are simple, but they force the graph to connect back to meaning. If the sentence is hard to write, the graph may not be understood well enough yet.
This is also helpful when switching between homework, tutoring, and exam review. Homework often rewards the final answer, tutoring rewards a clear explanation, and exam review rewards speed without losing accuracy. A quick calculator check supports all three, as long as it stays in the right role. Use it to verify, compare, and notice patterns, then keep the actual reasoning in the written work where it belongs.